-
Xuntong specializes in testing services for electrical accessories, consumer electronics, lighting, wireless, toys and other products.



 Service Hotline 18617145297
LED lamp light intensity distribution curve test rotation method:
On the basis of the old light distribution curve testing method, if one more axis rotation is added, light distribution curves at different angles can be artificially set in turn, and then transmitted to the computer through data integration, and simulated by software. A spatial three-dimensional LED light intensity distribution image can be formed. The principle of the rotation method is shown in.
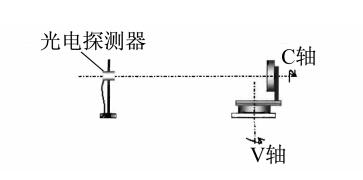
The rotation method adds a C-axis based on the traditional light distribution curve testing method, which is the connecting line from the physical center of the LED optical axis to the center of the detector. During measurement, the C-axis does not rotate, and the V-axis is rotated 180° to obtain a planar LED light distribution curve. Then rotate the C axis for a fixed angle (the measurer can set the division by himself), fix the C axis again, and rotate the V axis, so that the light distribution curve on another plane with a different angle can be obtained. After multiple measurements (the number of measurements is related to the size of the C-axis rotation division), the light distribution curves of multiple planes in the entire space can be obtained. After computer integration, a complete spatial light intensity distribution curve can be obtained.
This method is based on first testing the light intensity distribution curve of the plane, then setting a rotation axis, and obtaining the entire spatial light intensity distribution through multiple measurements at multiple angles through 360° rotation. Another rotation method is to also set two rotation axes to obtain light distribution curves of multiple planes with different angles and integrate them into a spatial light intensity distribution curve. This method is a light intensity distribution test method recommended by CIE(International Commission on Luminous Illumination) for testing low-power light-emitting devices.
 WeChat


 Submission Successful
 WeChat Official Account